
No data available.
Schedule some posts and come back later to check their performance!
Reports
Unlock in-depth analytics
Cross-channel social media insights
Track growth and post performance
Analyze competitors and hashtags
Generate PDF analytics reports
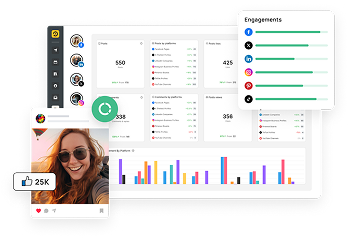

All Social Accounts
Aggregated analytics across all connected accounts
Posts
Posts by platforms
-
 Facebook Page
+25% 40
-
 X (Twitter) Profile
+22% 55
-
 LinkedIn Company
+15% 90
-
 Instagram Business Profile
+16% 110
-
 Pinterest Board
+18% 130
-
 TikTok Profile
+25% 25
-
 *YouTube Channel
100
-
 Threads Profile
+18% 100
-
 Bluesky Profile
+18% 100
Post likes
Likes by platforms
-
Facebook Page
+10% 33
-
X (Twitter) Profile
+75% 35
-
LinkedIn Company
+12% 94
-
Instagram Business Profile
+15% 45
-
Pinterest Board
0% 0
-
TikTok Profile
0% 0
-
*YouTube Channel
0
-
Threads Profile
+18% 100
-
Bluesky Profile
+18% 100
Post comments
Comments by platforms
-
Facebook Page
+25% 80
-
X (Twitter) Profile
+12.5% 72
-
LinkedIn Company
+27% 28
-
Instagram Business Profile
+25% 80
-
Pinterest Board
+9% 70
-
TikTok Profile
-40% 8
-
*YouTube Channel
0
-
Threads Profile
+18% 100
-
Bluesky Profile
+18% 100
Post views
Views by platforms
-
Facebook Page
+75% 70
-
X (Twitter) Profile
+50% 75
-
LinkedIn Company
+50% 30
-
Instagram Business Profile
+90% 80
-
Pinterest Board
+67% 50
-
TikTok Profile
-75% 4
-
*YouTube Channel
0
-
Threads Profile
+18% 100
-
Bluesky Profile
+18% 100
Post shares
Shares by platforms
-
Facebook Page
+22% 55
-
X (Twitter) Profile
NA
-
LinkedIn Company
+17% 35
-
Instagram Business Profile
NA
-
Pinterest Board
+32% 95
-
TikTok Profile
NA
-
*YouTube Channel
NA
-
Threads Profile
NA
-
Bluesky Profile
NA
Link clicks
Link clicks by platforms
-
Facebook Page
+15% 312
-
X (Twitter) Profile
+17% 240
-
LinkedIn Company
+15% 198
-
Instagram Business Profile
+15% 60
-
Pinterest Board
+20% 180
-
TikTok Profile
-10% 36Tracking off
-
*YouTube Channel
150
-
Threads Profile
+18% 60
-
Bluesky Profile
+17% 48Tracking off
Total Engagements by Account
Combined likes, comments, and views per account. Sorted by total engagements.
Performance by Account
Compare key metrics across each connected social account for the selected time period.
| Account | Likes | Shares | Comments | Retweets | Posts | Views | Link clicks |
|---|---|---|---|---|---|---|---|
 |
33 +10% | 15 +20% | 80 +25% | 12 +8% | 40 +25% | 70 +75% | 28 +15% |
 |
18 +5% | 7 -10% | 22 -12% | 0 0% | 12 -8% | 45 +20% | 14 +6% |
 |
35 +75% | 20 +30% | 72 +12% | 45 +55% | 55 +22% | 75 +50% | 18 +12% |
|
|
45 +15% | 22 +18% | 80 +25% | 0 0% | 110 +16% | 80 +90% | 32 +22% |
 |
12 +8% | 5 +4% | 15 +3% | 0 0% | 8 -5% | 30 +15% | 9 +7% |
|
|
0 0% | 0 0% | 0 0% | 0 0% | 100 +18% | 0 0% | 0 0% |
|
|
0 0% | 18 +12% | 8 -40% | 0 0% | 25 +25% | 4 -75% | 6 -30%Tracking off |
 |
0 0% | 0 0% | 12 +8% | 0 0% | 18 +10% | 95 +22% | 22 +14% |
 |
94 +12% | 35 +20% | 28 +27% | 0 0% | 90 +15% | 30 +50% | 18 +9% |
|
|
28 +8% | 12 +10% | 12 +15% | 0 0% | 22 +5% | 18 +10% | 8 +5% |
|
|
0 0% | 95 +32% | 70 +9% | 0 0% | 130 +18% | 50 +67% | 42 +28% |
|
|
62 +18% | 25 +14% | 38 +22% | 0 0% | 45 +12% | 52 +35% | 15 +10% |
|
|
35 +15% | 18 +9% | 18 +10% | 0 0% | 28 +8% | 22 +12% | 10 +6% |
Engagement By Platform
See how people are engaging with your posts during the reporting period.
Engagement Mix
Distribution of total engagements by type across all platforms.
Platform Share of Voice
Posts published per platform as a share of total output during the reporting period.
Posts Published Daily
Total posts published across all connected accounts each day during the reporting period.
Engagements Over Time
Total engagements (likes, comments, shares, and views) per platform over the selected period.
Likes & Comments Trend
Daily trend of total likes and comments across all platforms.
Views Trend
Daily total post views across all connected accounts.
Engagement by library
See how people are engaging with your posts during the reporting period.
| Library | Posts | Likes | Shares | Comments | Retweets | Views | Clicks |
|---|---|---|---|---|---|---|---|
| My Blogs |
22
|
22
|
22
|
22
|
22
|
22
|
22
|
| Marketing Posts |
40
|
40
|
40
|
40
|
40
|
40
|
40
|
Top Posts
Review your top posts published during the selected time period, based on the post’s lifetime performance.